An economic mapping depicts the interaction between economically relevant agents (firms, business associations, supporting institutions, government, etc.), including the intensity of interaction and main characteristics of the relationship
The purpose of an economic mapping is threefold. First, it serves to identify the actors who play a role in a given cluster - firms and types of firms, supporting institutions, associations, government, and others. Second, it is a way to depict the flows between firms and with supporting institutions. Third, it also is way to visualize the power structure between the economic actors.
The procedure is very straightforward: Take a piece of paper, preferably in size A-3 (42 x 29,7 cm) or larger and ask the interview partner or the participants of a workshop to draw. Your role, especially when working with a group of people, is basically that of an observer - taking notes on the comments the participants make when they draw the map, perhaps asking them to clarify certain issues, and asking about actors they have not mentioned on their own but who in your view may be important. The optimum size of a group to do mapping is 3 to 5 persons. It is feasible to do it with a larger group, but actually it is often more interesting, and also more fun, to split the group so that afterwards you have two or maybe three maps. Comparing them, and discussing the differences with the participants, may render important additional insights.
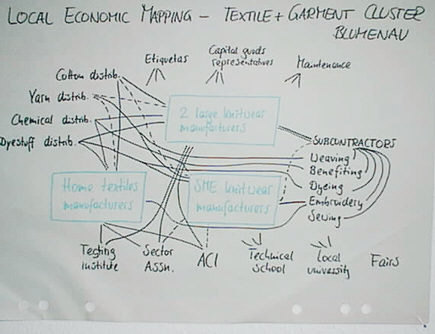
What are the main traps and errors? Actually, there are not many. Participants may confuse this kind of mapping with other types, i.e. the political and the value chain mapping, but that does not really create a problem. Participants may have contrary opinions about certain issues; you may suggest to note this in the mapping, or you may take an according note yourself. The following figure gives an idea of how an economic map may look like.
More of...
mapping
![]()
![]() economic
economic
![]() mapping
mapping
![]() mapping
of
mapping
of
![]() the value
the value
![]() system
system
![]() local
political
local
political
![]() mapping
mapping